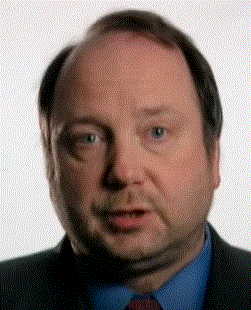
 Kim Rossmo
 Kim Rossmo stated: "The San Francisco murder differs significantly from the Zodiac's other crimes. Up to this point he was hunting in locations that had a good probability of containing his desired victims. Target selection was a function of area, not of an individual. However, it is unlikely the Zodiac was successful in all his searches; serial killers typically engage in extensive hunting activities, and for every attack there are many unsuccessful search attempts. In San Francisco, however, the Zodiac controlled the situation through his selection of victim type. The need for such control could be indicative of the distance the Zodiac had to travel to the crime site. Criminals who travel longer distances to offend are less likely to use uncertain target selection techniques. In respect to the killer's home residence, he continued "There's a number of possibilities. But remember, Rancho Vallejo was possibly 26,000 people at that time, of which only 13,000 will be male, and only a certain proportion of those are of the correct age, and a certain portion of those are only going to be white. Then we start looking at the neighborhoods involved, we have a pretty small subset. Then we start combining that with some of the personal and behavioral descriptors, and then we work in the vehicle information. If this case was active today, it would not be too difficult to find this person."
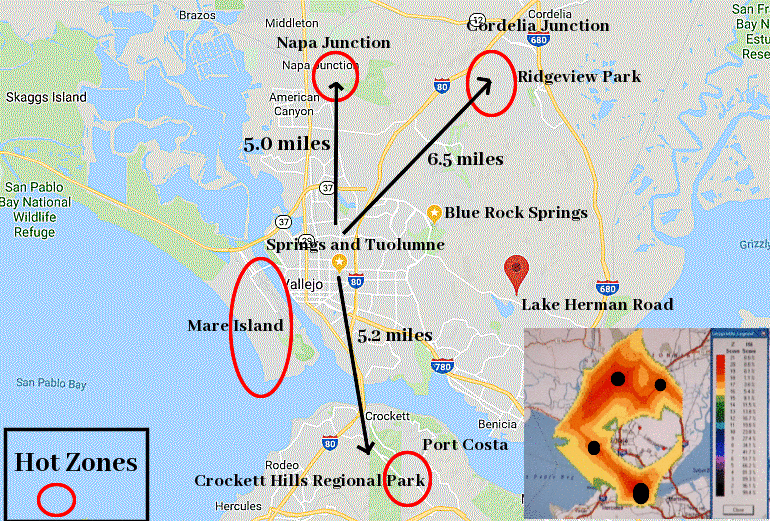
There is an excellent interactive online tool that has generated geo-profiling heat maps for killers such as Jack the Ripper, Dennis Rader (BTK), Atlanta Child Murders, Golden State Killer, Night Stalker, Yorkshire Ripper, Long Island Serial Killer and more. It can be found here at geographicprofiler.com. The Kim Rossmo heat map for the Zodiac Killer is located here.
You can toggle the geoprofile using the sidebar to remove the heat map and identify the locations underneath the color. The red color is the most likely residence of the Zodiac Killer, with a graded scale to the least likely areas of purple and beyond. This is classified as a percentage search cost (link) - Suspects are ranked based on their search cost—the percentage of the map searched before reaching the suspect’s anchor point. The search is conducted from the highest point of probability to the lowest; therefore, the lower the search cost, the more viable the suspect. If the geographic profile is accurate, the offender will have a low search cost. In the case of search cost, “map” refers to only the portion of the profile containing the crime scenes. As a result, suspects can have a search cost greater than 100%, which means a space larger than the area containing the crime scenes would have to be searched before reaching their anchor point.
This means we target the red hot zones first, before extending outwards to orange, yellow, green, blue etc.The hot zones will inevitably sometimes fall over an unpopulated area, so the areas around them become the focus of our search. The technique of geographic profiling is a supportive tool to narrow the suspect pool and search parameters, especially in a case over 50 years old with limited physical evidence - narrowing the search field in order to prioritize our efforts. The possible candidates for the Zodiac Killer can be massively whittled down, as shown in the case of Rancho Vallejo, highlighted by Kim Rossmo above. After all, he did state "If this case was active today, it would not be too difficult to find this person."


 RSS Feed
